Distorted EASE2 regional masks
This snippet produces a map with the EASE2 regional masks (file downloaded from here: https://daacdata.apps.nsidc.org/pub/DATASETS/nsidc0780_seaice_polarstereo_grid_v1/netcdf/, file NSIDC-0780_SeaIceRegions_EASE2-N25km_v1.0.nc). In some regions, the coastlines do not match the region contours. The same occurs for the EASE2 land mask, which contains only land, ocean and land ice (downloaded here: https://daacdata.apps.nsidc.org/pub/DATASETS/nsidc0609_loci_ease2/north/, file EASE2_N25km.LOCImask_land50_coast0km.720x720.bin).
NB: pcolormesh instead of contourf was tested, but the result looked the same.
Solution (thanks @lkalesch!): Replace ccrs.NorthPolarStereo()
in line 16 by ccrs.LambertAzimuthalEqualArea(central_longitude=0.0, central_latitude=90.0)
######################
### Import modules ###
######################
import numpy as np
import xarray as xr
import cartopy.crs as ccrs
import pylab as plt
import os,sys
########################
### Define functions ###
########################
import numpy as np
## Define function for map
def makemap():
fig, ax = plt.subplots(nrows=1,ncols=1,subplot_kw={'projection': ccrs.NorthPolarStereo()},figsize=(10,10))
ax.set_extent([-180, 180, 60,90], ccrs.PlateCarree())
ax.coastlines(resolution = "10m");
ax.gridlines();
return fig,ax
####################################
### Load and plot regional masks ###
####################################
# Regional masks
## Load data
datadir = "."
f = xr.open_dataset(os.path.join(datadir,"NSIDC-0780_SeaIceRegions_EASE2-N25km_v1.0.nc"),engine = "netcdf4") # open file with regional masks
flags = np.array(f.data_vars["sea_ice_region_surface_mask"]) # extract region flags
flags[flags > 18] = 19 # flags above 18 are land, inland water, shelf ice etc
## Get flags and ticks for plotting
levels = np.arange(np.min(flags),np.max(flags)+2) # create contour levels
names = f.sea_ice_region_surface_mask.attrs["flag_meanings"].split(" ") # get names of regions
ticklocs = np.arange(0,20) # get location for colorbar ticks
ticklabels = f.sea_ice_region.attrs["flag_meanings"].split(" ") + ["land"] # get labels for colorbar ticks
## Do the plotting
fig, ax = makemap() # create map
im = ax.contourf(f.coords["x"],f.coords["y"],flags,levels = levels-.5, cmap = plt.colormaps["tab20"]) # contour plot with regions
cb = plt.colorbar(im,fraction=0.044*(f.coords["x"].shape[0]/f.coords["y"].shape[0]),ticks = ticklocs) # add colorbar
cb.ax.set_yticklabels(ticklabels,fontdict={"size":18}) # customised ticklabels
fig.show()
#########################################
### Load and plot ice/land/ocean mask ###
#########################################
# Land/water mask
f_lm = open("./EASE2_N25km.LOCImask_land50_coast0km.720x720.bin", mode="rb") # open landmask file
lm_1d = np.fromfile(f_lm, dtype=np.uint8) # get 1d values
lm_2d = np.reshape(lm_1d,(720,720)) # reshape to 2d grid
lm_2d[lm_2d == 101] = 1 # alter flags for contour plotting
lm_2d[lm_2d == 254] = 2
lm_2d[lm_2d == 255] = 3
levels = np.arange(np.min(lm_2d), np.max(lm_2d)+2)-.5 # create contour levels
ticklocs = np.arange(0,4) # get location for colorbar ticks
names = ["Land","Ice","Out of map","Water"]
ticklabels = ["Land","Ice","Out of map","Water"] # ticklabels
fig, ax = makemap()
ax.set_title("EASE2 land/water mask, provided by NSIDC",fontsize = 24)
im = ax.contourf(f.coords["x"],f.coords["y"],lm_2d,levels = levels, cmap = plt.colormaps["tab20"])
cb = plt.colorbar(im,fraction=0.044*(f.coords["x"].shape[0]/f.coords["y"].shape[0]),ticks = [0,1,2,3])
cb.ax.set_yticklabels(names,fontdict={"size":18})
fig.show()
-
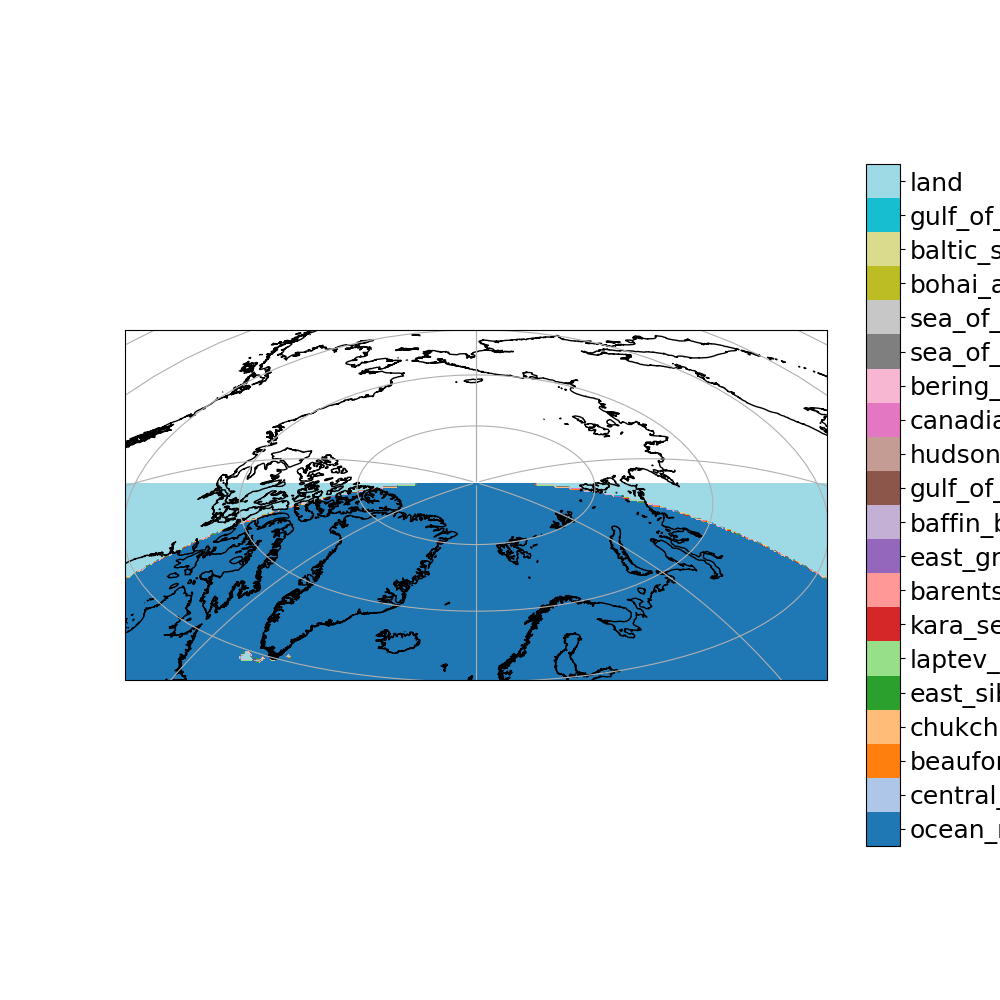
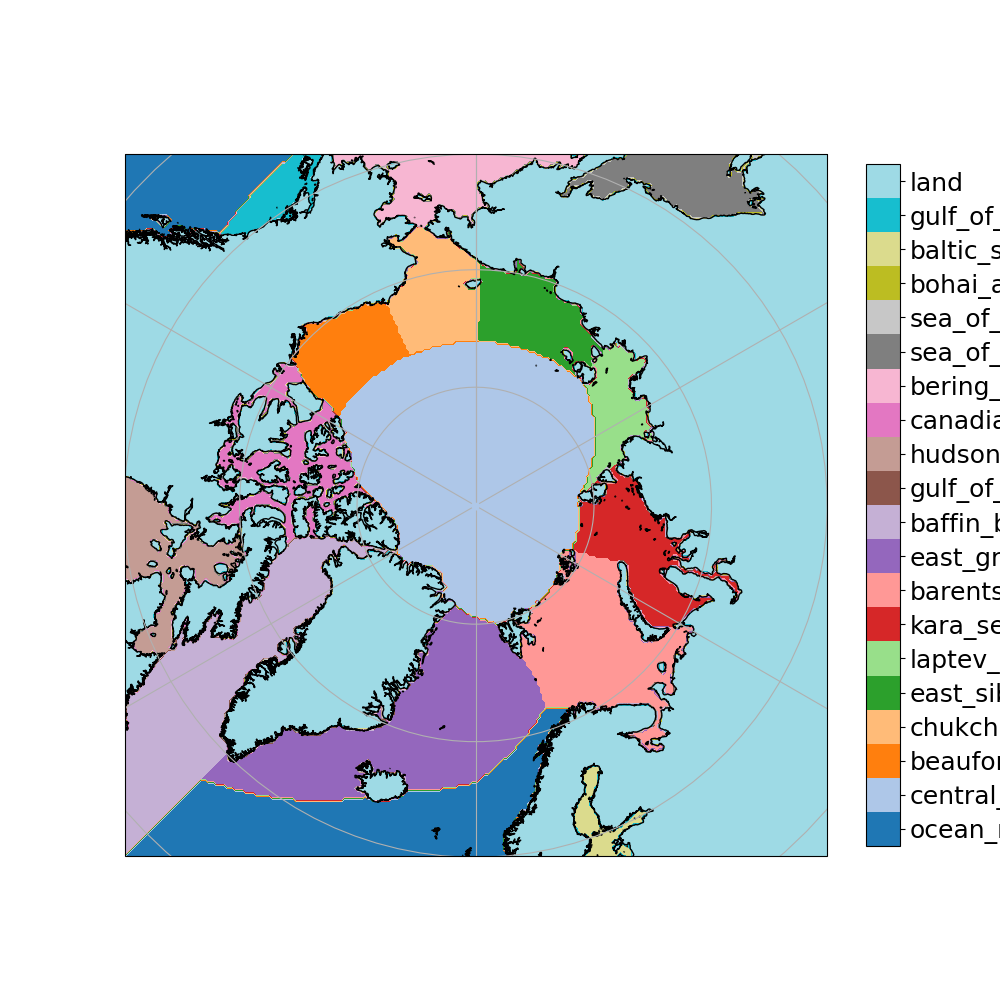
This is the netCDF file which is used for the regional masks: NSIDC-0780_SeaIceRegions_EASE2-N25km_v1.0.nc and this is the one with the land/ice/ocean mask: EASE2_N25km.LOCImask_land50_coast0km.720x720.bin
Edited by Valentin Ludwig